For this I used the pro_football_reference_web_scraper library to get data from Pro Football Reference and using Python to analyze the results.
Python has powerful libraries that make analyzing data easier and visual
Getting the data
import pandas as pd

from pro_football_reference_web_scraper import team_game_log as t

team22_game_log = t.get_team_game_log(team='New York Jets', season=2022)
team22_game_log["Season"] = "2022"
team23_game_log = t.get_team_game_log(team='New York Jets', season=2023)
team23_game_log["Season"] = "2023"
team_df = pd.concat([team22_game_log, team23_game_log], ignore_index=True, sort=False)
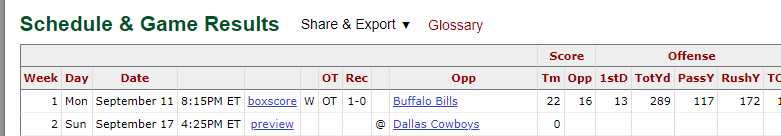
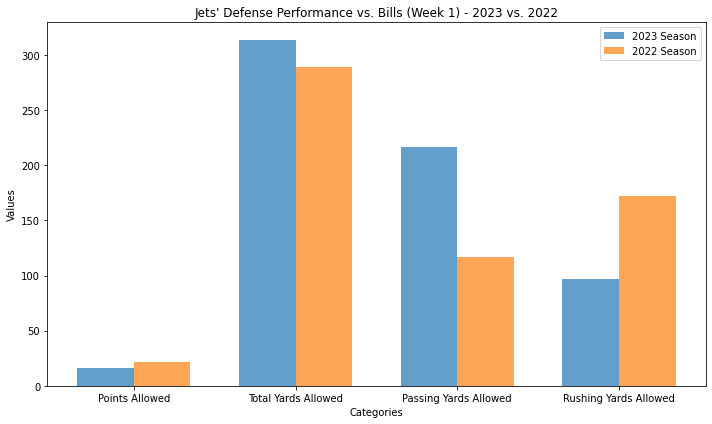
Here’s a summary of the relevant data for the Jets’ defense performance against the Bills in Week 1 of the 2023 season and their performance against the Bills in Week 17 of the 2022 season:
2023 Season (Week 1 – Jets vs. Bills):
- Home Team: New York Jets
- Result: W (Jets won)
- Points Allowed: 16
- Total Yards Allowed: 314
- Passing Yards Allowed: 217
- Rushing Yards Allowed: 97
2022 Season (Week 17 – Jets vs. Bills):
- Home Team: New York Jets
- Result: W (Jets won)
- Points Allowed: 22
- Total Yards Allowed: 289
- Passing Yards Allowed: 117
- Rushing Yards Allowed: 172
Now, let’s make insights based on this data:
- Points Allowed: In Week 1 of the 2023 season, the Jets’ defense allowed 16 points, which is an improvement compared to Week 17 of the 2022 season when they allowed 22 points. This indicates that the Jets’ defense performed better in terms of limiting the Bills’ scoring.
- Total Yards Allowed: In Week 1 of the 2023 season, the Jets’ defense allowed 314 total yards, while in Week 17 of the 2022 season, they allowed 289 total yards. There is a slight increase in total yards allowed in 2023, suggesting that the defense faced a more challenging offensive opponent in the 2023 season opener.
- Passing Yards Allowed: In Week 1 of the 2023 season, the Jets’ defense allowed 217 passing yards, which is higher than the 117 passing yards allowed in Week 17 of the 2022 season. This indicates that the Bills’ passing offense was more successful against the Jets’ defense in 2023.
- Rushing Yards Allowed: In Week 1 of the 2023 season, the Jets’ defense allowed 97 rushing yards, which is lower than the 172 rushing yards allowed in Week 17 of the 2022 season. The Jets’ defense performed better in terms of limiting the Bills’ rushing attack in 2023.
In summary, the Jets’ defense showed improvements in terms of points allowed and rushing yards allowed in their Week 1 matchup against the Bills in the 2023 season compared to the same matchup in the 2022 season. However, they allowed more passing yards in the 2023 season opener. These insights suggest that the Jets’ defense had a mixed performance against the Bills, and further analysis might be needed to understand the factors contributing to these changes in performance.
Graphing the data using matplotlib
import matplotlib.pyplot as plt


# Categories for the bar chart
categories = ['Points Allowed', 'Total Yards Allowed', 'Passing Yards Allowed', 'Rushing Yards Allowed']

# Values for 2023 and 2022 seasons
values_2023 = [points_allowed_2023, total_yards_allowed_2023, passing_yards_allowed_2023, rushing_yards_allowed_2023]
values_2022 = [points_allowed_2022, total_yards_allowed_2022, passing_yards_allowed_2022, rushing_yards_allowed_2022]

# Create subplots for comparison
fig, ax = plt.subplots(figsize=(10, 6))

# Bar width
bar_width = 0.35

# X-axis positions for bars
x = range(len(categories))

# Plot bars for 2023 and 2022 seasons
bar1 = ax.bar(x, values_2023, bar_width, label='2023 Season', alpha=0.7)
bar2 = ax.bar([i + bar_width for i in x], values_2022, bar_width, label='2022 Season', alpha=0.7)

# Set labels, title, and legend
ax.set_xlabel('Categories')
ax.set_ylabel('Values')
ax.set_title('Jets\' Defense Performance vs. Bills (Week 1) - 2023 vs. 2022')
ax.set_xticks([i + bar_width/2 for i in x])
ax.set_xticklabels(categories)
ax.legend()

# Display the chart
plt.tight_layout()
plt.show()