We specialize in using Python and data tools to make better use of your ad account
This blog post is about an air duct cleaning we work with, and how using Python’s powerful data libraries, we can better analyze their performance for future campaigns
Use the following code and your data by exporting it from Google Ads!
import pandas as pd

# Read the CSV file into a pandas DataFrame
df = pd.read_csv('ppc-ad-account-data.csv', header=0)
df

# Data Cleaning and Transformation
# Remove the dollar signs ($) from columns containing currency values and convert them to numeric
columns_with_currency = ['Cost', 'Avg. CPC', 'Cost / conv.']
for col in columns_with_currency:
    df[col] = df[col].str.replace('$', '').str.replace(',', '').astype(float)

# Summary Statistics
summary_stats = df.describe()

# Calculate total Clicks, Cost, Phone calls, Conversions, and Cost / conv.
total_clicks = df['Clicks'].sum()
total_cost = df['Cost'].sum()
total_phone_calls = df['Phone calls'].sum()
total_conversions = df['Conversions'].sum()
avg_cost_per_click = total_cost / total_clicks

# Print the calculated values
print(f"Total Clicks: {total_clicks}")
print(f"Total Cost: ${total_cost:.2f}")
print(f"Total Phone calls: {total_phone_calls}")
print(f"Total Conversions: {total_conversions}")
print(f"Average Cost per Click: ${avg_cost_per_click:.2f}")
- Total Clicks: 11,458
- Total Cost: $XXX,XXX.XX
- Total Phone calls: 462
- Total Conversions: 1,028.5
- Average Cost per Click: $9.75
# Monthly Clicks and Conversions plot
import matplotlib.pyplot as plt

plt.figure(figsize=(12, 6))
plt.plot(df['Month'], df['Clicks'], label='Clicks', marker='o')
plt.plot(df['Month'], df['Conversions'], label='Conversions', marker='o')
plt.xlabel('Month')
plt.ylabel('Count')
plt.title('Monthly Clicks and Conversions')
plt.xticks(rotation=45)
plt.legend()
plt.grid(True)
plt.tight_layout()

# Show the plot
plt.show()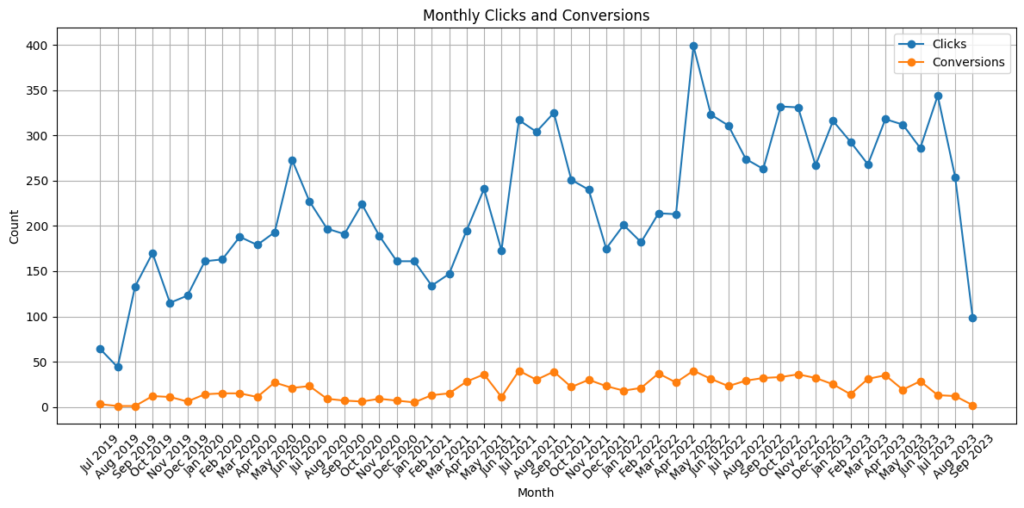
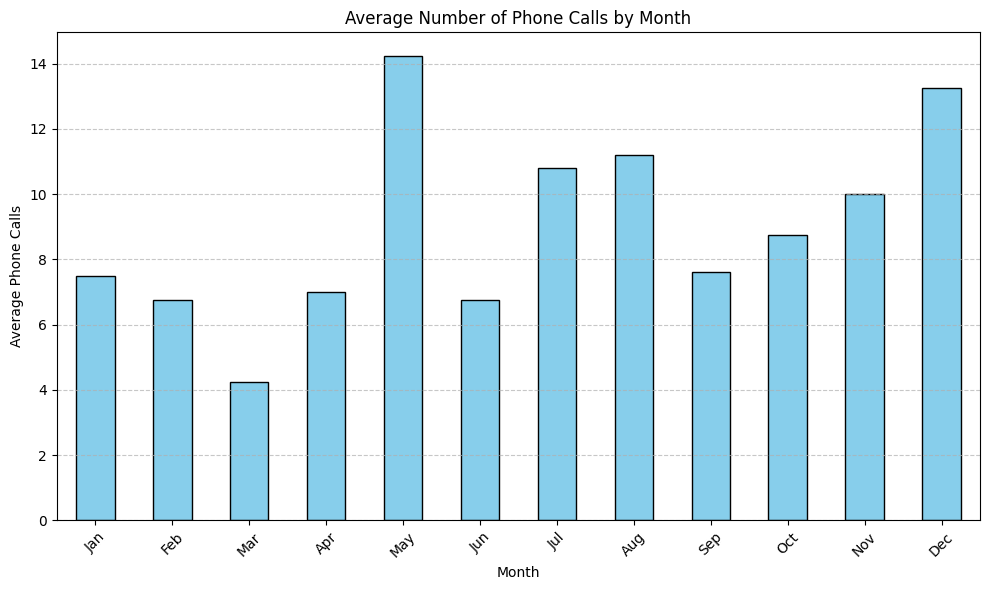
# Calculate the average number of phone calls for each month
df["Month of year"] = df['Month'].dt.month
df['Month of year'] = df['Month'].dt.strftime('%b')
monthly_avg_calls = df.groupby(df['Month of year'])['Phone calls'].mean()

# Define the order of months to ensure proper plotting
months_order = ['Jan', 'Feb', 'Mar', 'Apr', 'May', 'Jun', 'Jul', 'Aug', 'Sep', 'Oct', 'Nov', 'Dec']

# Create a bar plot for average phone calls per month
plt.figure(figsize=(10, 6))
monthly_avg_calls[months_order].plot(kind='bar', color='skyblue', edgecolor='black')
plt.xlabel('Month')
plt.ylabel('Average Phone Calls')
plt.title('Average Number of Phone Calls by Month')
plt.xticks(rotation=45)
plt.grid(axis='y', linestyle='--', alpha=0.7)
plt.tight_layout()

# Show the plot
plt.show()
Using data to make better insights and strategies
Certainly, for any local business, identifying the best time of the year to focus on advertising and marketing efforts is crucial. Let’s delve deeper into the data and provide insights into the seasonality and optimal months for this specific business.
Understanding Seasonality
Air duct cleaning services may have distinct seasonal trends due to several factors, such as weather, air quality concerns, and consumer behavior. Here are some insights into the best times of the year for an air duct cleaning company:
- Fall and Spring Cleaning: One noticeable trend in the data is that the fall and spring months appear to be particularly promising for this business. These are transitional seasons when homeowners often consider cleaning their HVAC systems. As the weather changes, people prepare for different seasons by ensuring their heating or cooling systems are in good condition.
- Fall (October): October 2019 stood out with the highest number of clicks (170). This could be attributed to homeowners getting ready for the colder months and wanting to ensure their heating systems are efficient and safe.
- Spring (May): May 2020 recorded the most conversions (27). Spring is a time when many households embark on spring cleaning, and this includes cleaning and maintaining their air ducts for better indoor air quality.
Optimal Marketing Strategies
Based on the insights into seasonality, here are some marketing strategies to consider for an air duct cleaning company:
- Seasonal Campaigns: Launch targeted ad campaigns and promotions during the fall and spring months when demand for air duct cleaning services is likely to be higher. Highlight the benefits of clean air ducts in improving indoor air quality.
- Pre-Season Offers: Create pre-season offers and incentives to encourage customers to schedule their air duct cleaning before the peak season hits. This can help secure bookings in advance.
- Educational Content: Produce informative content, such as blog posts or videos, that educate homeowners about the importance of regular air duct cleaning. Share this content leading up to the peak seasons to generate interest and awareness.
- Adapt to Local Weather: Consider local weather patterns and conditions. In regions with extremely cold winters or hot summers, promoting duct cleaning before these extreme seasons can be particularly effective.
- Conversion Tracking: Ensure robust conversion tracking and attribution modeling to understand the customer journey. This will help optimize ad spend and refine targeting during peak seasons.
- Customer Retention: Use the peak seasons to not only acquire new customers but also focus on providing exceptional service to encourage repeat business and referrals.
In summary, for an air duct cleaning company, the best times of the year to concentrate marketing efforts are during the transitional seasons of fall and spring. Leveraging these insights and implementing targeted marketing strategies can lead to increased customer acquisition and business growth during these peak periods.